Excel and SPSS

    • Mode- Live Online/Offline
    • 100% practical sessions
    • Latest syllabus and Case studies
    • 50+ Marketing tools
    • Learn from Industry expert

Excel and SPSS

Months

4 Months

Course Duration

Modules

16 Modules

Course Modules

Offline

Offline/Online

Mode

Overview

Master the art of data analysis with our Advanced Excel course and IBM SPSS Course, designed to equip you with industry-relevant skills for handling and analyzing complex datasets. In today’s data-driven world, proficiency in Excel and SPSS is essential for professionals in fields like business analytics, research, and data science.

This comprehensive course covers everything from advanced Excel functions, data visualization, and automation using VBA to statistical analysis and predictive modeling with IBM SPSS.

Tools Covered

Download Brochure

Course Curriculum


  • → Overview of the Excel Interface

  • → Navigation and Ribbon Customization

  • → Creating and Saving Workbooks

  • → Basic Cell Operations (Enter, Edit, and Delete)

  • → Shortcuts and Productivity Tips


  • → Basic Formulas: SUM, AVERAGE, COUNT

  • → Text Functions: CONCATENATE, LEFT, RIGHT, MID

  • → Logical Functions: IF, AND, OR

  • → Date and Time Functions: TODAY, NOW, DATEDIF


  • → Sorting and Filtering Data

  • → Conditional Formatting

  • → Data Validation

  • → Creating Drop-Down Lists


  • → VLOOKUP and HLOOKUP

  • → INDEX and MATCH

  • → Combining INDEX-MATCH with Arrays

  • → Advanced Logical Functions: IFS and SWITCH


  • → Creating and Formatting Charts

  • → Pivot Tables and Pivot Charts

  • → Conditional Formatting with Data Bars and Heat Maps

  • → Creating Interactive Dashboards


  • → Data Cleaning Techniques

  • → Removing Duplicates

  • → Splitting and Merging Data


  • → Introduction to Macros

  • → Recording and Running Macros

  • → Editing Macros with VBA

  • → Automating Repetitive Tasks


  • → Data Analysis ToolPak

  • → Goal Seek and Scenario Manager

  • → Solver for Optimization

  • → Forecasting and Trend Analysis


  • → Overview of SPSS Interface

  • → Importing and Managing Data Files

  • → Understanding Variable Types

  • → Creating and Labeling Variables


  • → Sorting and Filtering Data

  • → Recoding Variables

  • → Merging and Splitting Data Sets

  • → Data Cleaning in SPSS


  • → Measures of Central Tendency: Mean, Median, Mode

  • → Measures of Dispersion: Standard Deviation, Variance

  • → Frequency Tables

  • → Cross-Tabulations


  • → Introduction to Hypothesis Testing

  • → T-Tests (One-Sample, Independent, Paired)

  • → Chi-Square Test

  • → ANOVA (One-Way and Two-Way)


  • → Pearson and Spearman Correlation

  • → Simple Linear Regression

  • → Multiple Linear Regression

  • → Interpreting Outputs and Model Summary


  • → Advanced Statistical Analysis

  • → Cluster Analysis

  • → Logistic Regression

  • → Time Series Analysis


  • → Creating Graphs and Charts

  • → Customizing Visualizations

  • → Exporting Reports and Graphs

  • → Interactive Dashboards in SPSS


  • → Hands-on Projects Integrating Excel and SPSS

  • → Data Analysis Workflow for Business Problems

  • → Data Analysis Workflow for Business Problems

  • → Final Project Evaluation and Feedback

Certificate

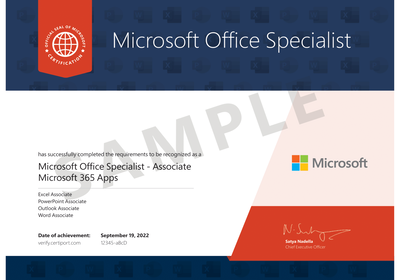
Secure your career with an industry-recognized certificate that validates your expertise in Excel and IBM SPSS, you will also be certified by Microsoft which will further boost your credibility, enhance your resume, and open the doors to limitless career opportunities
Certificate
Certificate from company
Certificate
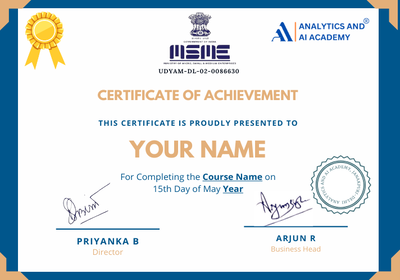
Course completion certificate

Get certified by leading global companies

Authorized training and certification programs powered by top MNCs. Learn from the best, get globally recognized

Get future-ready with Global certifications

Authorized IBM Certification Partner

Earn an official
certification by
IBM

Professionals at Your Service

FAQ’s

This course is ideal for professionals, students, and researchers who want to enhance their data analysis skills using advanced Excel techniques and IBM SPSS.

Basic knowledge of Excel and statistical concepts is recommended but not mandatory, as the course starts with foundational topics.

You’ll master functions like VLOOKUP, INDEX-MATCH, Pivot Tables, data visualization, macros, VBA automation, and advanced data analysis techniques.

Topics include data management, descriptive statistics, hypothesis testing, regression analysis, factor analysis, and advanced statistical modeling.

The course is divided into 16 modules covering both Advanced Excel and IBM SPSS, with practical assignments and real-world projects.

Student feedback and experiences

WhatsApp