Business Analytics

    • Mode- Live Online/Offline
    • 100% practical sessions
    • Latest syllabus and Case studies
    • 50+ Marketing tools
    • Learn from Industry expert

Business Analytics

Months

4 Months

Course Duration

Modules

16 Modules

Course Modules

Offline

Offline/Online

Mode

Overview

The Business Analytics/Data Analytics Course is a vital skill set that empowers professionals and companies to make well-informed budget-friendly decision. This comprehensive program includes hands-on business analytics training along with a globally recognized IBM business analytics certification. Learn the most in-demand tools like Python, SQL, Power BI, Tableau and more to extract the meaning full insights benefitable for business growth, this program will also cover fundamentals of statistics and data visualization. Whether you are searching for a data analytics institute near you or exploring online data analytics courses, this course equips you with the expertise to excel in the corporate world. Earn your business analytics certificate from IBM and unlock endless career opportunities.

Tools Covered

Download Brochure

Course Curriculum


  • → Introduction to the course

  • → Scope of Data/Business Analytics

  • → Types of data: qualitative and quantitative/primary vs. secondary

  • → Qualitative data collection techniques (FGDs and Depth interviews)

  • → Use of various data collection techniques across various business domains

  • → Quantitative data collection techniques (Survey)

  • → Quantitative data collection techniques (Experiments)


  • → Overview of Excel Interface

  • → Key Formulas and Functions

  • → Ranges and Tables

  • → Data Cleaning – Text Functions, Dates and Times

  • → Sorting and Filtering


  • → Pivots

  • → Data Analysis in Excel – Trends and Patterns

  • → Data Visualization in Excel – Charts and Plots

  • → Working With Multiple Worksheets


  • → Introduction to Business Intelligence (BI)

  • → Use cases of BI

  • → Various BI tools

  • → Building blocks of Power BI

  • → Data Extraction

  • → Connect to SQL and other platforms

  • → Import Data from Excel


  • → Power Query Editor

  • → Understanding of Data Types

  • → Data profiling and naming convention

  • → Working with parameters

  • → Merge and Append query

  • → Group by of Data (Data aggregation)

  • → Transpose of Data

  • → Pivot and Unpivot of Data


  • → Replace Data Split columns

  • → Data Relationships and DAX

  • → DAX Syntax and Functions

  • → Time and Data functions

  • → DAX Features

  • → Power BI and Visualization

  • → Formatting and customizing visuals

  • → Combinations charts (dual axis charts)

  • → Custom Visualization-Filter pane, Slicer


  • → Interface of Tableau (Layout, Toolbars, Data Pane, Analytics Pane, etc.)

  • → Live vs extract connection

  • → Basic charts and Dual Axes charts

  • → Tableau data types

  • → Connection to Excel

  • → Management of metadata and extracts


  • → Filtering in Tableau

  • → Types of Filters

  • → K-Means Cluster analysis

  • → Visual Analytics in Tableau

  • → Forecasting, confidence interval, reference lines, and bands


  • → Plotting longitude and latitude

  • → Customizing geocoding, polygon maps, WMS: web mapping services

  • → Map visualization, custom territories

  • → Calculation syntax and functions in Tableau

  • → Types of calculations (Table, String, Date, Aggregate, Logic, and Number)


  • → SQL's Role in Data Retrieval and Manipulation

  • → Basic Select Statement for Data Retrieval

  • → Retrieving Specific Columns and All Columns

  • → Using Distinct to Remove Duplicates

  • → Introduction to Data Models & Er Diagrams

  • → Relational Vs. Transactional Models

  • → How Data Is Organized in Tables

  • → Filtering Data with Where Clause

  • → Sorting Data with Order By

  • → Limiting Results with Limit

  • → Using Aliases for Column Names


  • → Creating And Using Temporary Tables

  • → Designing a Simple Database Schema

  • → Introduction To Data Modelling

  • → Sorting Data with Order By (advanced)

  • → Advanced Filtering with In, or, And, Not

  • → Performing Mathematical Operations on Data

  • → Introduction To Aggregate Functions (count, Sum, Avg, Max, Min)

  • → Grouping Data with Group By

  • → Filtering Grouped Data with Having

  • → Understanding Subqueries and Their Types

  • → Performing Join Operations (inner Join, Left Join, Right Join, Full Outer Join)

  • → Updating And Deleting Data With SQL

  • → Analyzing Data with Simple Statistics


  • → Descript Statistics

  • → Measure of Central Tendency: Mean, Media, Mode, Dispersion

  • → Variance and Standard Deviation

  • → Correlations concepts

  • → Linear and Multiple regression

  • → Hypothesis testing


  • → Probability Basics, It’s Rules and Notation

  • → Probability Distribution – Discrete and Continuous

  • → Normal Distribution and Properties

  • → Central Limit Theorem and Its Importance

  • → Skewness and T-Distribution


  • → Software download

  • → Introduction to IBM SPSS

  • → Introduction to Functions and Variables

  • → Insurance, Banking and Healthcare data analysis


  • → Overview of Python

  • → Understanding Statements, Expressions, And Indentation.

  • → Overview of Identifiers, Keywords, And Comments.

  • → Variables: Declaration, Assignment, And Naming Conventions

  • → Common Data Types: Integers, Floats, Strings.

  • → Type Casting and Conversion

  • → Operators In Python

  • → Hands-on Activity


  • → Conditional Statements & Loops

  • → Loop Control Statements: Break, Continue, Pass

  • → Defining And Calling Functions

  • → Function Parameters and Return Values.

  • → Scope Of Variables (global And Local)

  • → Advanced Functions

  • → Default Values and Variable-length Arguments

  • → Function Parameters and Return Values.

  • → Default Values and Variable-length Arguments

  • → Recursive Functions

  • → Map, Reduce, and Filter

  • → Introduction to Exceptions

  • → Try, Except, and Finally Blocks

  • → Handling Common Errors

  • → Hands-on Activity

Certificate

Get an Industry recognized certificate in Business and Data Analytics, you will also be certified in IBM powered Business analysis and Python tools which will further boost your credibility, enhance your resume, and open the doors to limitless career opportunities
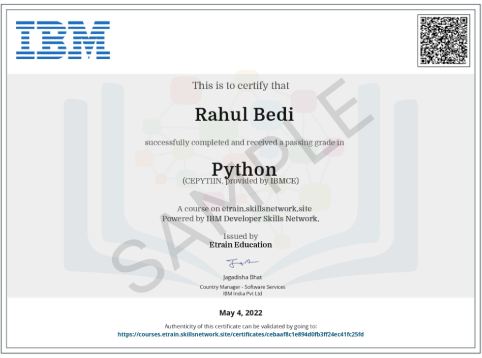
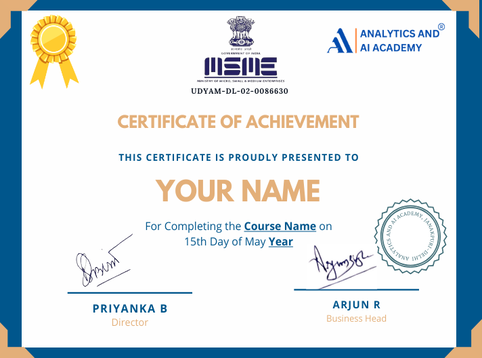
Certificate
Certificate from company
Certificate
Course completion certificate

Get certified by leading global companies

Authorized training and certification programs powered by top MNCs. Learn from the best, get globally recognized

Get future-ready with Global certifications

Authorized IBM Certification Partner

Earn an official
certification by
IBM

Professionals at Your Service

FAQ’s

A Business Analytics course teaches data-driven decision-making, covering tools like Excel, SQL, and Power BI, statistical analysis, and business intelligence to solve real-world problems.

More or less these courses are same but Business Analytics focuses on strategic decision-making and business insights, while Data Analytics emphasizes technical skills, data processing, and statistical analysis to uncover patterns and trends

Yes the course modules are designed in such a way that it covers all the aspects of Business Analytics and Data Analytics

This course is ideal for professionals, and students, looking to build or advance their careers in Data driver world.

The course typically takes 6 months to complete, with 4-5 months of rigorous classroom sessions and 2 months of internship.

Student feedback and experiences

WhatsApp